Arction

software list
Arction
FOR .NET

High-performance WPF, WinForms & UWP Charts & Graphs
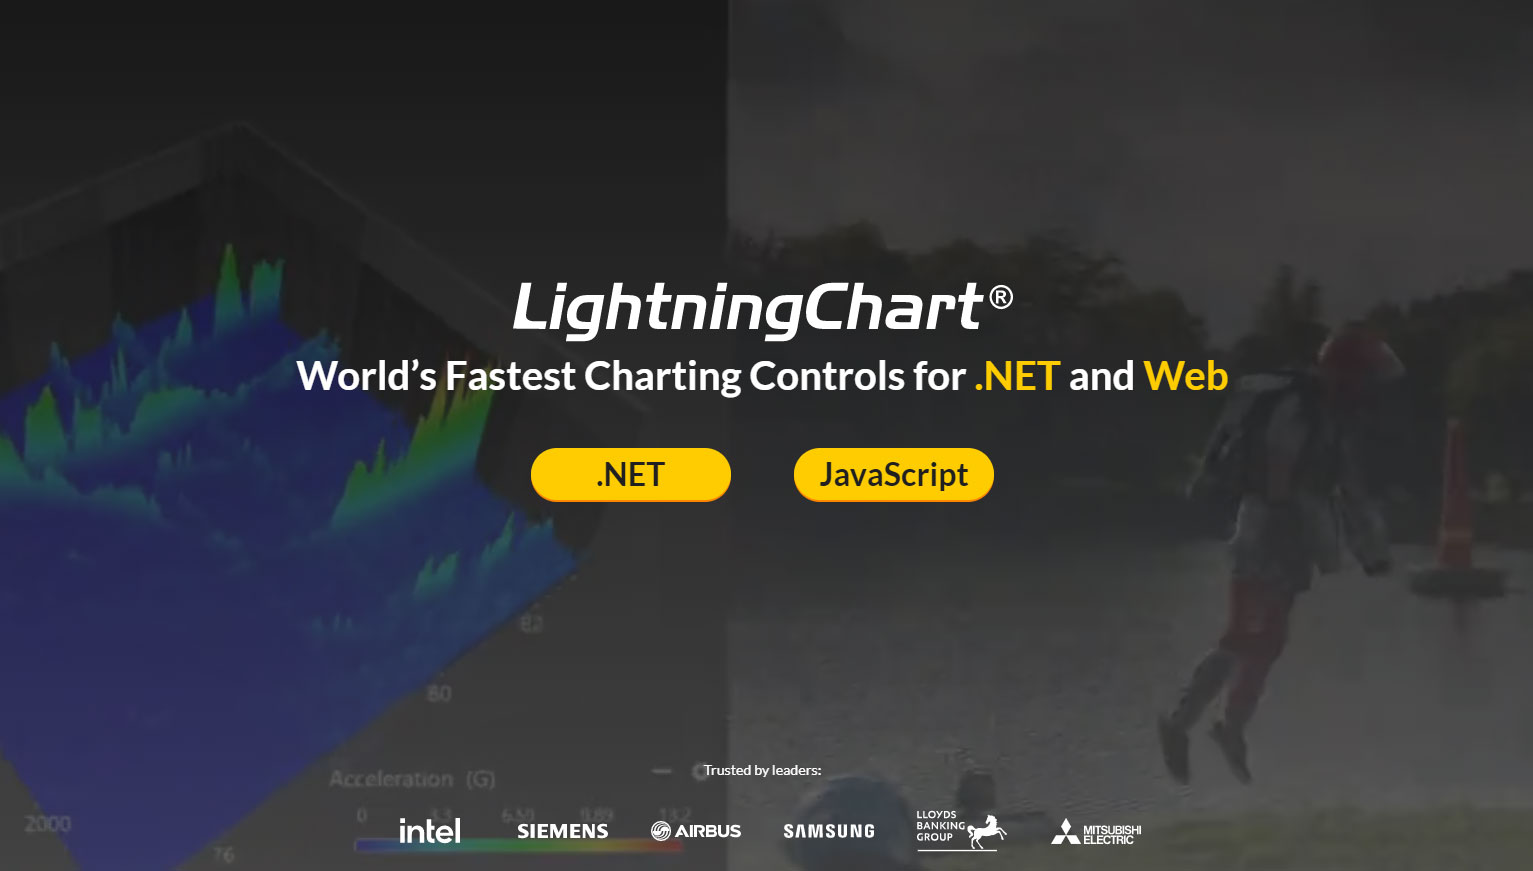
LightningChart .NET can visualize up to 16 BILLION data points in real-time.
World’s Fastest .NET Charts
XY charts
The most definitive 2D cartesian chart, with the best rendering performance in the industry. Visualize your complex and huge data sets, with our optimized series types, shared X axes, built-in real-time scrolling modes and industry leading configuration options.
FOR JS
Lightning-fast, interactive & responsive 2D & 3D
JavaScript charts.
Next Generation, World’s Fastest JS Charts
JS Interactive examples
Interactive Examples is an easy-to-use exploration tool to help you get started quickly with the most important concepts. In here you can search, view and edit charts on-the-fly.
API-links can be found conveniently right next to each example and below the chart example there is a link to the example’s GitHub page.
Intuitive User Experience
Easy and convenient to manage dozens of charts, legend boxes, buttons, check boxes and other UI elements. Resource-efficient rendering of all charts in one GPU scene also makes resizing columns and rows very fast.
JavaScript Charts with smooth animations exceeding all industry standards in amount of data per chart. Intuitive touch screen interactivity with zooming, panning, moving data cursors etc.
GPU acceleration & WebGL rendering ensure that your device’s graphics processor is utilized efficiently, which results in an outstanding execution performance.
LightningChart JS supports Server side rendering. It can be used with our headless package available in npm. Use our charts in a server application to produce high-quality chart images.
With LightningChart JS you have an abundance of resources to get cosy with the library. API documentation, interactive examples and more – visit our resources page to access all this.