LightningChart

software list
LightningChart | JS
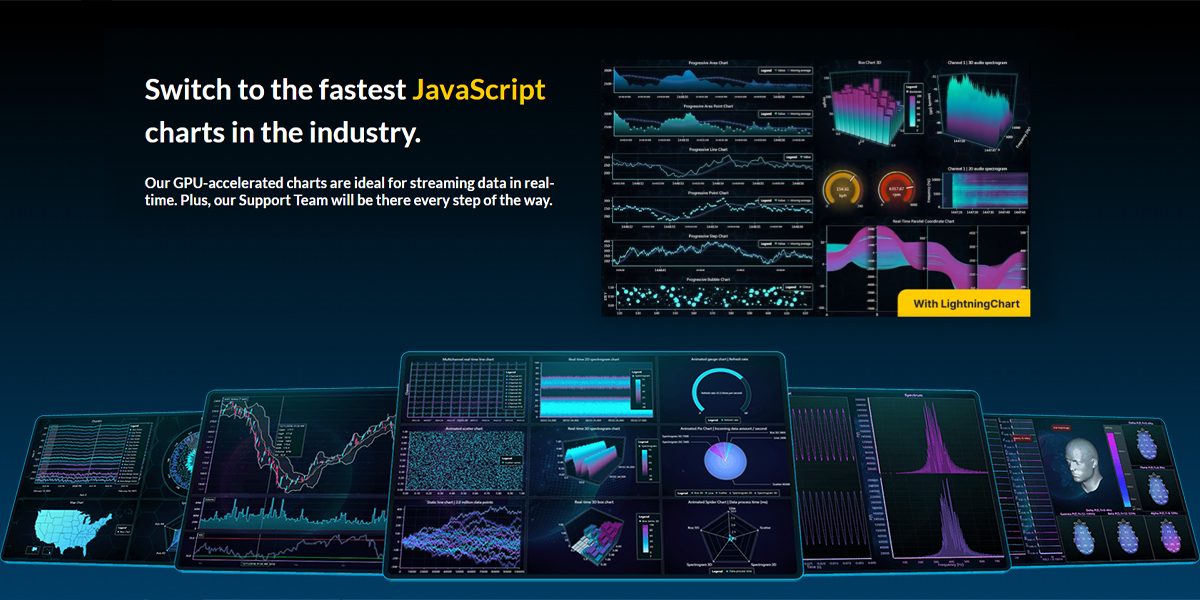
Switch to the fastest JavaScript charts in the industry.
Our GPU-accelerated charts are ideal for streaming data in real-time. Plus, our Support Team will be there every step of the way.
JS Interactive examples
Interactive Examples is an easy-to-use exploration tool to help you get started quickly with the most important concepts. In here you can search, view and edit charts on-the-fly.
API-links can be found conveniently right next to each example and below the chart example there is a link to the example’s GitHub page.
Line Charts
Featuring multiple real-time and static line series types, linear axes, scaling modes, logarithmic axes, and markers and data cursors. Supports millions of data points at the fastest loading speeds and FPS rates.
LightningChart | .NET
Fastest .NET Chart Built for Real-Time Visualization
LightningChart .NET delivers unmatched rendering speed, deep customization, and expert technical onboarding.
.NET Interactive Examples
Easily browse thru 100+ examples. Run them quickly in the Interactive Examples application, and extract code project in Visual Studio with click of a button.
Why LightningChart .NET?
LightningChart .NET charts are the fastest 2D & 3D .NET charts data visualization SDK for WPF, WinForms, and UWP. It has been actively developed since 2009.
The charting library contains over 170 interactive .NET charts with rich functionality that is suitable for the creation of applications within the most demanding industries: science and research, engineering, economics and finance, trading, medicine, energy, space, and defense