FusionCharts

software list
FusionCharts
Build beautiful web & mobile dashboards
With our interactive and responsive charts, extensive documentation, consistent API, and cross-browser support - your next great dashboard starts here!

FusionCharts Suite XT

FusionCharts helps you build beautiful dashboards for your web & mobile projects. With extensive documentation, cross-browser support, and a consistent API, it is easier than ever to add interactive and responsive charts. From simple charts like line, column, and pie to domain-specific charts like heatmaps, radar, and stock charts we’ve got you covered. Start building your dashboards with FusionCharts today. FusionCharts Suite XT has extensive self-support options including documentation, knowledge base and 20K strong community forum that are available 24x7.
Trusted by over 800,000 developers across 28,000 companies, you are sure to add delight to your reports, dashboards, analytics and surveys with FusionCharts Suite XT.
FusionTime
Create high-performance time-series visualizations and stock charts in JavaScript (HTML5)
FusionTime helps you visualize time-series and stock data in JavaScript, with just a few lines of code. Whether it’s a simple time-series chart, stock chart, millions of data points in a chart, or even complex multivariate analysis, you can render all of them with the same ease-of-use.
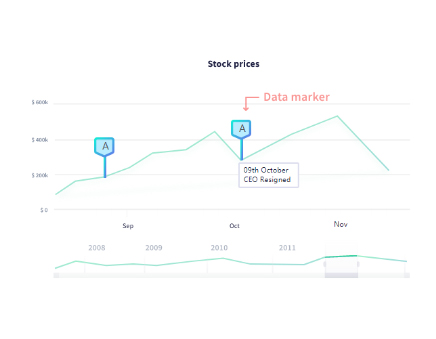
You get out-of-the-box interactivity like time navigator, date range selectors, tooltips with crosslines, interactive legend and much more. In addition, you can plot your data as column, line, area, candlestick, OHLC and even variants like stacked column & area, and overlay them with event and data markers.
And the best part is - the same chart runs across desktop, tablet and mobile, through responsive layouts, on all modern browsers - without any additional effort on your side.
FusionExport

Export full dashboards in multiple formats (PDF, image). Go beyond export of individual charts - enable download of livedashboards or automatically generate them on server in an email-friendly format.
FusionExport enables you to convert your live dashboards to PDF or images. It works with all JavaScript charting libraries (FusionCharts, HighCharts, d3, Chart.js or others) and is easy to install. It includes SDKs for Java, Node.js, C#, Go and many more.
Not only can you export a dashboard as-is, but you can also add new elements to the exported dashboard on-the-fly including your brand logo, colors, additional data in form of tables, and anything else that you want.